
In On Death and Dying (1969), Dr. Elisabeth Kübler-Ross described how people respond to profound loss. She first described these responses at the bedsides of the dying, and she herself extended them to other kinds of loss and change, including, with her agreement, the workplace. Today the Kübler-Ross Change Curve® is used by leaders, coaches, clinicians and teams around the world.
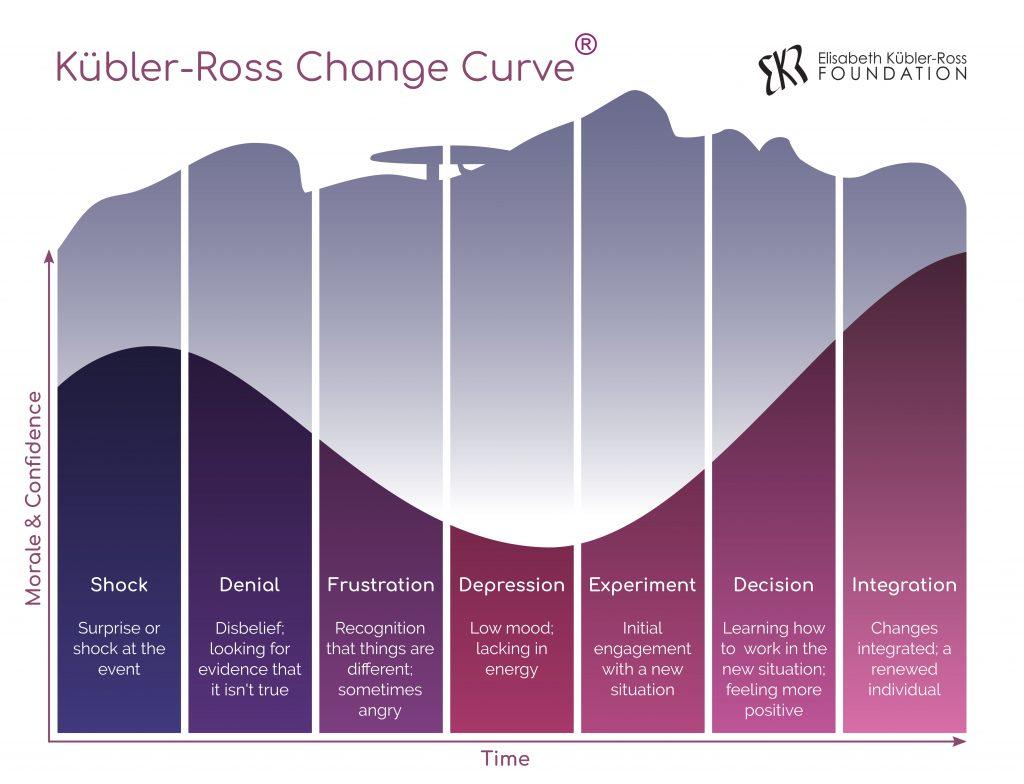
The Foundation’s graphic. Look at the upper line: it is Elisabeth’s own profile, watching over the curve.
The Change Curve has been drawn in different forms over the years, with more or fewer columns and different words. Every drawing simplifies. The Foundation’s own graphic, for example, shows a single Denial column, although Elisabeth named three kinds of denial. A curve gives the general shape. Her own charts and recordings show how much richer the real experience is.
Seven areas of experience
The Foundation’s graphic describes seven areas a person may enter, leave and return to. They are not steps to complete.
| Shock | Surprise or shock at the news |
| Denial | Disbelief; partial denial; looking for evidence that it isn’t true |
| Frustration | Anger, bargaining, guilt; recognizing that things are different |
| Depression | Grieving what is ending; low mood and energy |
| Experiment | First steps; trying out the new situation |
| Decision | Acceptance, not resignation; learning to work in the new situation |
| Integration | Changes integrated; a renewed individual |
How the model grew, 1965–1978
Elisabeth never stopped listening, and her model never stood still. Her own books, charts and recordings show it growing for more than a decade.
1965 · Listening first. At the University of Chicago, students from the Chicago Theological Seminary asked Elisabeth how to study death. Her answer was almost unheard of in medicine at the time: don’t read about dying, ask the dying. Over four years, she and her students interviewed hundreds of patients. The model came from the listening.
1969 · Five named, ten drawn. On Death and Dying gave chapters to denial and isolation, anger, bargaining, depression and acceptance, and a whole chapter to hope. The chart at the back of the book shows ten overlapping responses: shock, denial, partial denial, anger, depression, bargaining, preparatory grief, acceptance, decathexis and hope. She put the word “stages” in quotation marks herself. The same book describes the patient’s family going through the same responses.
1970 · Acceptance is not resignation. In a paper for her fellow psychiatrists, Elisabeth separated acceptance from resignation and named two promises every doctor owes a dying patient: I will not abandon you, and there is always hope.
1971 · Phases, not steps. In her own language, German, the book appeared as Interviews mit Sterbenden. The responses are Phasen (phases that overlap and return), not Stadien (fixed steps).
1973 · New words. In her recorded lectures, Coping With Death and Dying, Elisabeth named pseudo-denial and titled one lecture as a question: Acceptance or Resignation.
1974 · Beyond the dying. In Questions and Answers on Death and Dying, she described patients losing their sight and young Vietnam veterans facing paralysis. None of them were dying, and all of them showed the same responses. Her model now described loss itself. She also wrote: “Most of my patients have exhibited two or three stages simultaneously, and these do not always occur in the same order.”
1978 · Held inside hope and dreams. Elisabeth drew her model again, this time with no timeline at all: denial, anger, bargaining and depression as four overlapping circles, with resolution and acceptance below, and the whole drawing held inside two rings marked Hope and
Where the Change Curve came from
Elisabeth Kübler-Ross did not design a management model. By 1974, in Questions and Answers on Death and Dying, she was already telling readers that people who lost their sight, or were paralyzed, went through the same stages as her dying patients. They were, in her words, the same stages as anyone else in the process of losing something very important. The model had left the patient's bed and become a description of loss.
People from business kept turning up at her Life, Death and Transition workshops and telling her the same thing: this is what happens to a company when it reorganizes. Her son Ken, who was there, remembers her agreeing that it fit, and declining to make it a workshop topic, because anything that took time away from the dying did not interest her. By the 1980s the model was being drawn as a curve in boardrooms. In 1995 her family began licensing it under her name. The graphic the Foundation uses today was drawn in 2002–03, and its upper line is her profile.
What the popular curve leaves out
Most versions of the curve show five smooth words on a line. Her own work was more precise. These distinctions come from her work with the dying, not from management theory, but anyone who has led people through change will recognize them.
More than one kind of denial
Her 1969 chart shows denial and partial denial, and by 1973 she was teaching a third: pseudo-denial. She described a "conspiracy of silence" in which everyone knows, and everyone keeps quiet to protect someone else. In an organization, the team that seems not to have heard the news may know perfectly well, and may be staying quiet for the leaders' sake.
Two kinds of depression
In 1969 she separated a reactive depression, about what has already been lost, from a preparatory one, about what is still coming, and said the two should be met quite differently. Grief for the old team or the old role is not the same as dread of what lies ahead. Encouragement that helps with one can miss the other entirely.
Acceptance, or resignation
By 1973 she taught the last stage as a fork: acceptance or resignation. Acceptance is reached after a real struggle; resignation is defeat and bitterness. From the doorway the two look the same: quiet, compliant, no longer arguing. A curve that ends in "acceptance" has no way to tell them apart.
Hope, the part most curves drop
On her 1969 chart, hope is the longest band, running beneath every other state from beginning to end. In 1970 she named two assurances a physician must give: that the clinician will not leave, and that there is always hope. Most change curves have no hope on them at all. People going through change need to know both things too.
Phases, not steps
Elisabeth was Swiss, writing in a second language, and "stage" was simply the English word she reached for. The German editions of her work, since 1971, have used Phasen, phases, never Stadien. A phase is closer to weather than to a staircase: it can come back, and it can overlap with another. Her last drawing of the model, in 1978, has no sequence at all: overlapping circles, held inside two rings labelled hope and dreams.
Using the curve well
Used as she intended, the curve is a tool for recognition, not prediction.
- Recognize, don't schedule. The curve helps name what people are feeling. It is not a timetable for when they should be finished.
- Expect overlap and return. People feel several of these at once, skip some, and come back to others when circumstances shift.
- Don't mistake quiet for acceptance. Resignation and pseudo-denial both look calm from the outside.
- Keep hope on the chart. Stay present, and keep a real reason for hope in view.
Telling someone the stages come in order leaves the person still angry months later feeling as if they are doing change wrong. Telling them there are no patterns at all leaves them with no map. What she offered was the thing in between: permission to feel what they feel.
Why there are so many versions
Career guides teach managers a seven-step Kübler-Ross Change Curve; wellness sites teach a five-step one to individuals; change-management platforms rank it alongside ADKAR and Kotter's model. Five became ten in her own hands, and in other people's it has become seven, or five again. The model keeps being redrawn because that is what a useful model is for, and the Foundation's version returns it to what she actually drew and taught.
Where to go from here
Learn it as she taught it
Self-paced online courses built from Elisabeth's own books, recordings, and workshops.
See the courses →Hear it in her own voice
Archival lectures and interviews with Dr. Kübler-Ross on the Foundation's YouTube channel.
Watch the videos →Licensing the Kübler-Ross Change Curve®
The Kübler-Ross Change Curve® is a registered trademark of the Elisabeth Kübler-Ross Family Limited Partnership. Using the curve or these diagrams in training materials, presentations, books, or other publications requires a license.
Please send license requests directly to the family's literary agent: Barbara Hogenson, Barbara Hogenson Agency, New York –
