
The Kübler-Ross Change Curve®

In 1969, Dr. Elisabeth Kübler-Ross introduced what later became widely known as the five stages—denial, anger, bargaining, depression, and acceptance—in On Death and Dying. Developed from her clinical work with seriously ill patients, these stages described common emotional responses to life-limiting illness and other profound forms of loss. Over time, the framework has been applied more broadly to experiences of change across clinical, personal, educational, and organizational settings.

Kübler-Ross consistently emphasized that the stages were never intended as a rigid sequence or universal pattern. In her later writings and lectures, including Questions and Answers on Death and Dying (1974), she clarified that individuals may move among stages, experience several simultaneously, or not experience certain stages at all. Her work also described a wider range of emotional responses—including shock, partial denial, anticipatory grief, hope, guilt, and anxiety—underscoring the variability of human adaptation to change and loss.

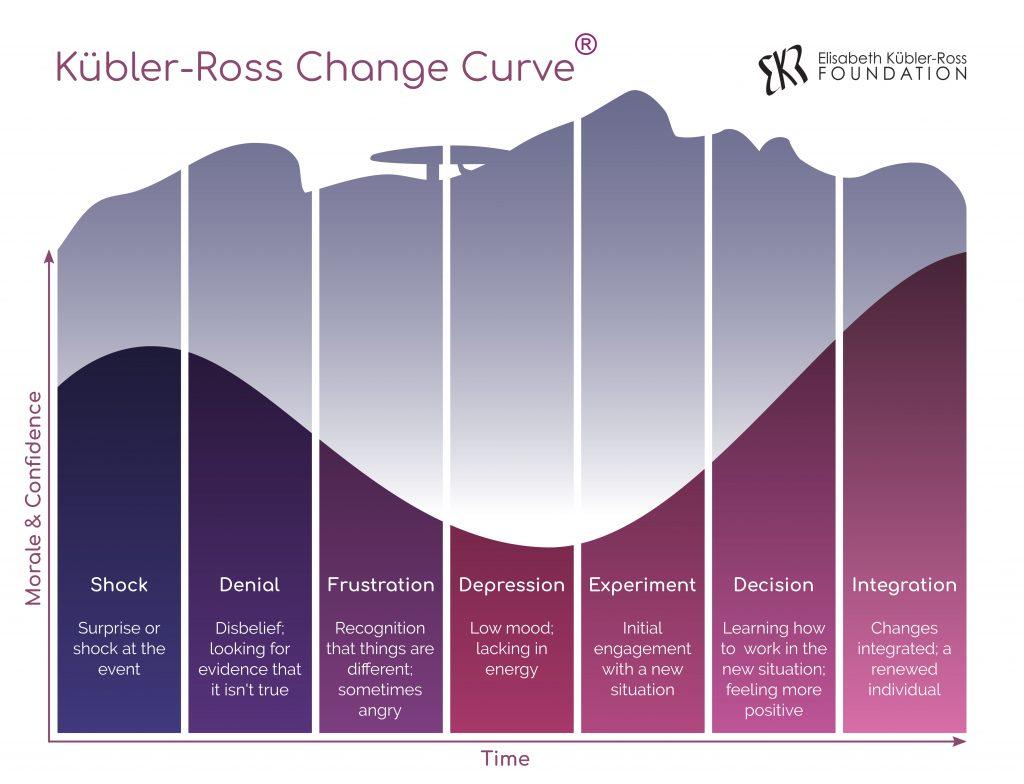
Since the late twentieth century, the stages have been adapted in leadership and organizational contexts as the Kübler-Ross Change Curve®. While commonly depicted visually for clarity, the process itself is best understood as fluid and nonlinear. People often revisit earlier responses as circumstances evolve, reflecting the dynamic and ongoing nature of adjustment.

The change curve offers a framework for understanding common emotional responses to significant transitions:

Shock and Denial often characterize early reactions, as individuals absorb new realities and begin to process their implications.
Anger and Frustration may arise as awareness deepens and the challenges of adjustment become clearer.
Bargaining and Reflection frequently accompany efforts to regain stability, control, or meaning.
Depression or Sadness may emerge as losses are more fully recognized and integrated emotionally.
Acceptance and Integration reflect growing adaptation as individuals begin to incorporate change into daily life.

Rather than representing fixed steps, these responses often overlap, recur, and unfold differently across individuals and situations. For many people, movement through the curve is uneven and cyclical rather than progressive. Setbacks, renewed challenges, or evolving circumstances may reawaken earlier responses over time.

Today, the Kübler-Ross Change Curve remains a widely used framework for understanding the emotional dimensions of change across many settings. Consistent with Kübler-Ross’ original perspective, its value lies not in predicting outcomes but in encouraging greater awareness, patience, and compassion for the varied ways people respond to loss, uncertainty, and transformation.
Where the Change Curve came from

Elisabeth Kübler-Ross did not design a management model. By 1974, in Questions and Answers on Death and Dying, she was already telling readers that people who lost their sight, or were paralyzed, went through the same stages as her dying patients. They were, in her words, the same stages as anyone else in the process of losing something very important. The model had left the patient's bed and become a description of loss.

People from business kept turning up at her Life, Death and Transition workshops and telling her the same thing: this is what happens to a company when it reorganizes. Her son Ken, who was there, remembers her agreeing that it fit, and declining to make it a workshop topic, because anything that took time away from the dying did not interest her. By the 1980s the model was being drawn as a curve in boardrooms. In 1995 her family began licensing it under her name. The graphic the Foundation uses today was drawn in 2002–03, and its upper line is her profile.

What the popular curve leaves out

Most versions of the curve show five smooth words on a line. Her own work was more precise. These distinctions come from her work with the dying, not from management theory, but anyone who has led people through change will recognize them.

More than one kind of denial

Her 1969 chart shows denial and partial denial, and by 1973 she was teaching a third: pseudo-denial. She described a "conspiracy of silence" in which everyone knows, and everyone keeps quiet to protect someone else. In an organization, the team that seems not to have heard the news may know perfectly well, and may be staying quiet for the leaders' sake.

Two kinds of depression

In 1969 she separated a reactive depression, about what has already been lost, from a preparatory one, about what is still coming, and said the two should be met quite differently. Grief for the old team or the old role is not the same as dread of what lies ahead. Encouragement that helps with one can miss the other entirely.

Acceptance, or resignation

By 1973 she taught the last stage as a fork: acceptance or resignation. Acceptance is reached after a real struggle; resignation is defeat and bitterness. From the doorway the two look the same: quiet, compliant, no longer arguing. A curve that ends in "acceptance" has no way to tell them apart.

Hope, the part most curves drop

On her 1969 chart, hope is the longest band, running beneath every other state from beginning to end. In 1970 she named two assurances a physician must give: that the clinician will not leave, and that there is always hope. Most change curves have no hope on them at all. People going through change need to know both things too.

Phases, not steps

Elisabeth was Swiss, writing in a second language, and "stage" was simply the English word she reached for. The German editions of her work, since 1971, have used Phasen, phases, never Stadien. A phase is closer to weather than to a staircase: it can come back, and it can overlap with another. Her last drawing of the model, in 1978, has no sequence at all: overlapping circles, held inside two rings labelled hope and dreams.

Using the curve well

Used as she intended, the curve is a tool for recognition, not prediction.

  • Recognize, don't schedule. The curve helps name what people are feeling. It is not a timetable for when they should be finished.
  • Expect overlap and return. People feel several of these at once, skip some, and come back to others when circumstances shift.
  • Don't mistake quiet for acceptance. Resignation and pseudo-denial both look calm from the outside.
  • Keep hope on the chart. Stay present, and keep a real reason for hope in view.

Telling someone the stages come in order leaves the person still angry months later feeling as if they are doing change wrong. Telling them there are no patterns at all leaves them with no map. What she offered was the thing in between: permission to feel what they feel.

Why there are so many versions

Career guides teach managers a seven-step Kübler-Ross Change Curve; wellness sites teach a five-step one to individuals; change-management platforms rank it alongside ADKAR and Kotter's model. Five became ten in her own hands, and in other people's it has become seven, or five again. The model keeps being redrawn because that is what a useful model is for, and the Foundation's version returns it to what she actually drew and taught.

Where to go from here

Learn it as she taught it

Self-paced online courses built from Elisabeth's own books, recordings, and workshops.

See the courses →

Hear it in her own voice

Archival lectures and interviews with Dr. Kübler-Ross on the Foundation's YouTube channel.

Watch the videos →

Going through a loss now?

Guidance and resources for people who are grieving.

Find grief support →

Licensing the Kübler-Ross Change Curve®

The Kübler-Ross Change Curve® is a registered trademark of the Elisabeth Kübler-Ross Family Limited Partnership. Using the curve or these diagrams in training materials, presentations, books, or other publications requires a license.

Please send license requests directly to the family's literary agent: Barbara Hogenson, Barbara Hogenson Agency, New York –